USAspending.gov
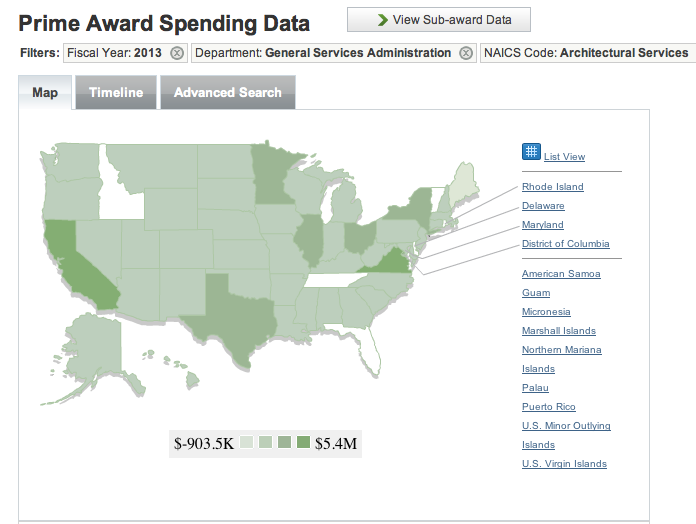
If you need to understand U.S. government spending, take a look at USAspending.gov. The first thing you see after a search is a map that lets you know at a glance which states have the most funding for whatever it is you’re looking up. For instance, here’s a search for GSA spending in 2013 on architectural services. Shown here is its accompanying map.
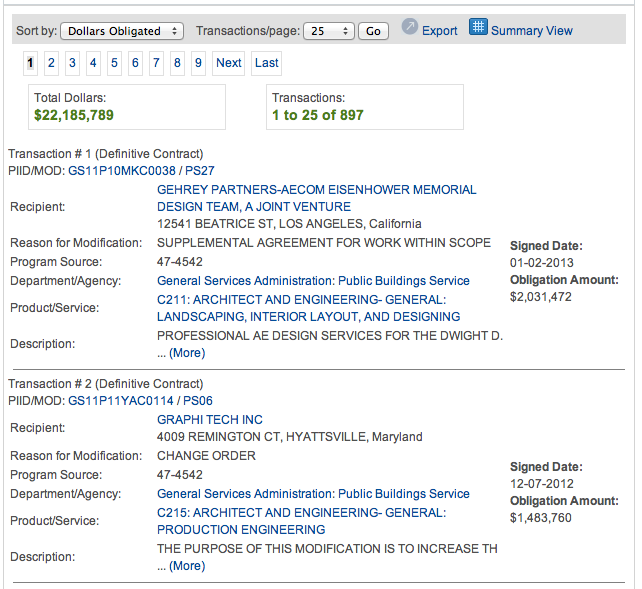
Then follows more detailed information on all of the transactions within your search. Here are the first two (of 897) transactions listed for the search for GSA spending on architectural services in 2013:
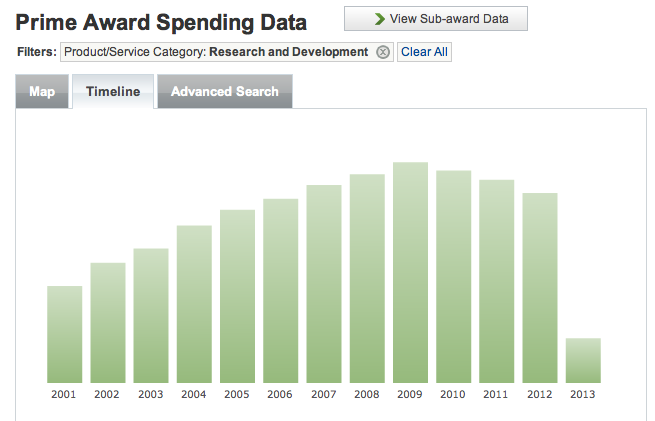
Or maybe you’re interested in grants awarded by the National Science Foundation in 2013. The possibilities go on and on since you can limit your search by type of spending, by agency, by extent competed, by recipient, by product or service code, by principle NAICS description, and by fiscal year. Or use the sub-awards search, or search by state. There’s also a timeline option, so you can see spending trends over time, like this one for general R&D spending. Commentary on this particular data set was posted previously.