
Energy use in the U.S. (charts)
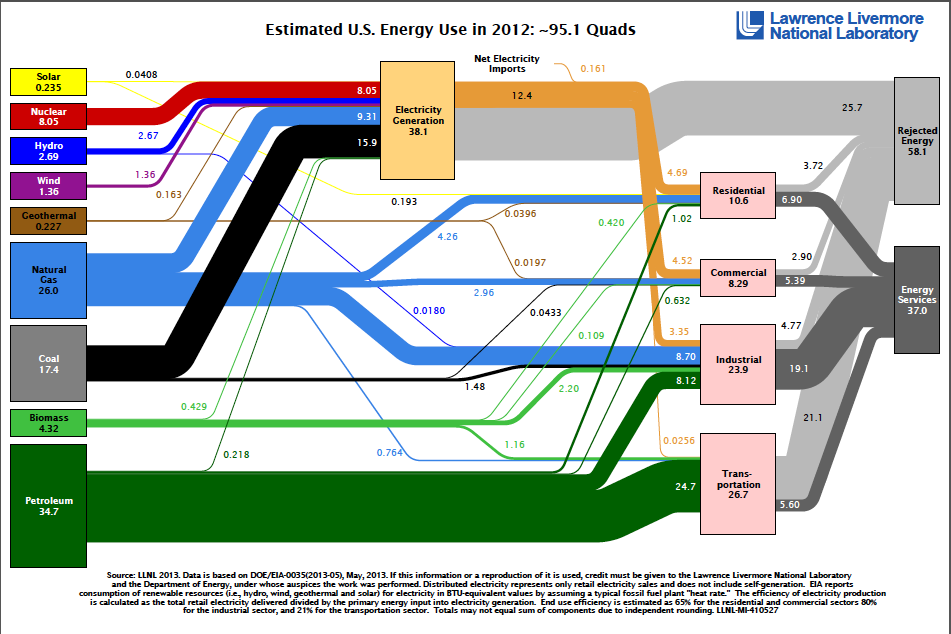
Americans continue to use more renewable energy sources – press release from Lawrence Livermore National Laboratory about their 2012 flow chart of energy use in the U.S. The “Rejected Energy” figure (upper right, in grey) has generated comment.
Once again, wind power saw the highest gains, going from 1.17 quads produced in 2011 up to 1.36 quads in 2012. New wind farms continue to come on line with bigger, more efficient turbines that have been developed in response to government-sponsored incentives to invest in renewable energy.
Solar also jumped from 0.158 quads in 2011 to 0.235 quads in 2012. Extraordinary declines in prices of photovoltaic panels, due to global oversupply, drove this shift.
This is the first year in at least a decade where there has been a measurable decrease in nuclear energy. …
The majority of energy use in 2012 was used for electricity generation (38.1 quads), followed by transportation, industrial, residential and consumption. However, energy use in the residential, commercial and transportation sectors decreased while industrial energy use increased slightly.
Lawrence Livermore has an interesting collection of current and archived flow charts here, on energy flow, carbon flow, water flow, and some international data (Canada, Mexico, North America).