
Big data and the first organizational chart
Big data in the age of the telegraph – the original organizational chart developed in 1854 by David McCallum of the New York and Erie Railroad offers surprisingly current lessons for dealing with today’s ‘big data’ issues and the flow of information through an organization. [To read this full McKinsey Quarterly article and to see the entire chart, you may have to go through a free registration process, well worth the few minutes it takes. -sb]
Daniel McCallum created the first organization chart in response to the information problem hobbling one of the longest railroads in the world. In surprising contrast to today’s top-down organization pyramids, in McCallum’s chart the hierarchy was reversed: authority over day-to-day scheduling and operations went to the divisional superintendents down the line, who oversaw the five branch lines of the railroad. The reasoning: they possessed the best operating data, were closer to the action, and thus were best placed to manage the line’s persistent inefficiencies. …
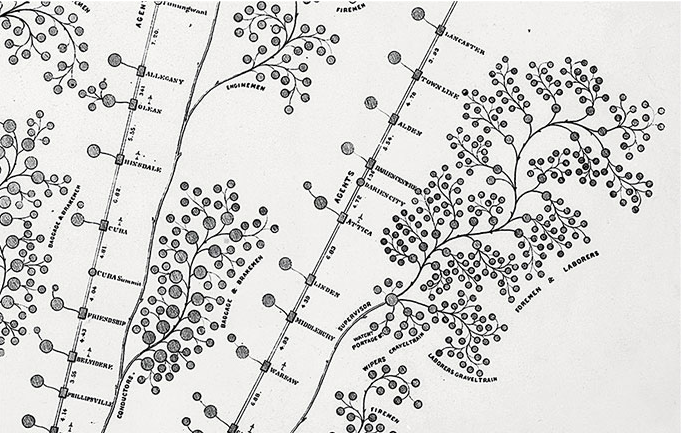
… In crafting the organizational plan, McCallum sought to improve the way the railroad used information. Through 21st-century eyes, the chart looks both antiquarian and surprisingly modern. Far from the static, hierarchical pyramids that we today associate with such charts, his was modeled after a tree. McCallum drew the board of directors as the roots, himself and his chief officers as the tree’s trunk, and the railroad’s divisions and departments as the branches.
Critically, McCallum gained control by giving up control, delegating authority to managers who could use information in real time. He put what we would call the organization’s C-level at the ground level, supporting the railroad, not directing its operations. Following one of McCallum’s key precepts—“a proper division of responsibilities”—authority over day-to-day scheduling went to the divisional superintendents down the line. …
… Even as McCallum decentralized decision making along the railroad, he also insisted that targeted metrics had to be reported back to its board of directors. That data flowed down from the branches of the tree to its roots, where McCallum and the board could use the information for oversight and long-term decision making. …
… Drowning in the details of operations, Daniel McCallum stepped back and redesigned the railroad’s organization. His insights on how to meld local authority with information gave his managers better operating tools—which are just as relevant in the age of the Internet as they were in the age of the telegraph.